
Listen to this article
The coffee you brewed this morning is about 20 percent more expensive than the same bag last year. The frozen hash browns at your local grocer might be up by a third. The bag of frozen tilapia at the chain across the parking lot is up nearly 50 percent for some brands. Tariffs introduced across 2025 and 2026 are working their way through the food supply chain, and the average household is now paying roughly $2,500 a year more in tariff-linked costs than the year before.

Tariffs are politically charged. The household budget question is not. Whatever you think about the policy, your grocery cart now costs more, and the question worth asking is: which categories, and what to do about it.
What is moving the most
The Federal Reserve Bank of Dallas measured tariff-driven core PCE inflation at about 0.80 percentage points higher in March 2026 than it would have been otherwise. That sounds small. It is not when it lands unevenly. The categories that have moved the most:
- Coffee. Up nearly 20 percent year over year. Supply disruptions in producing countries and tariff stacking on imports are both factors.
- Imported frozen seafood. Some SKUs up 40 to 50 percent at chain grocers.
- Canadian produce and frozen items. Common items like potato products, frozen vegetables, and certain berries have seen 20 to 30 percent increases.
- Wine and spirits from tariffed origins. Generally up 10 to 15 percent.
US-produced staples (dairy, eggs, in-season produce, US grown chicken and pork) have moved much less, sometimes not at all in real terms. That is the key insight for budget defense. The damage is not uniform across the cart.
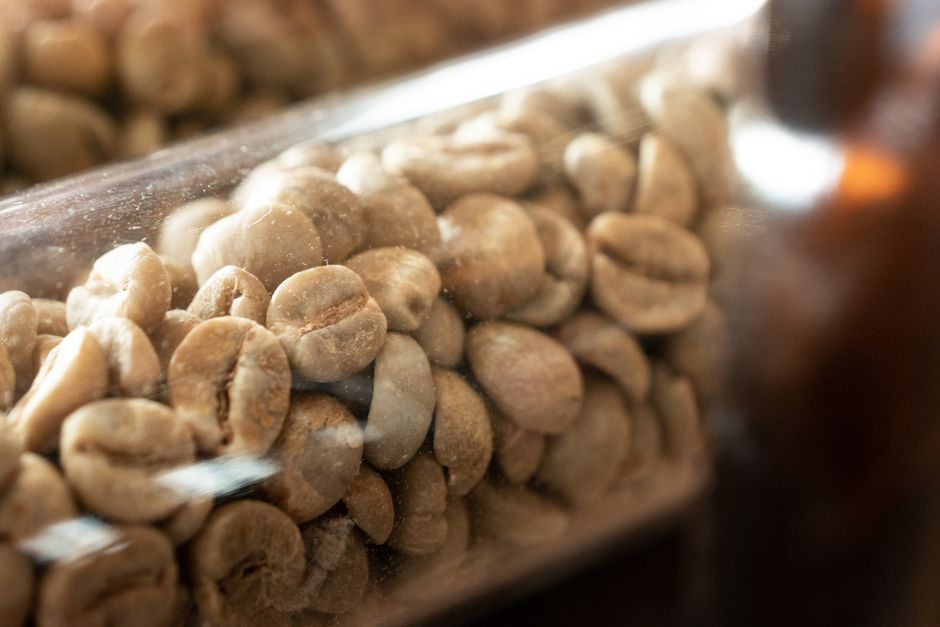
Photo by Hannoversche Kaffeemanufaktur on Pexels
Why this hits lower income households harder
Tariffs are regressive by design. Lower and middle income families spend a larger share of their income on physical goods (food, household supplies, clothing) that are directly exposed to import duties. The same percent increase in those categories takes a bigger bite out of a household earning $60,000 than one earning $200,000.
For most households, that means the right move is not waiting for prices to fall. Even if tariffs change tomorrow, food prices rarely move back down. What you usually get instead is a slower rate of increase. So the plan has to be: see the damage, adjust the budget, and find the substitutions where they actually exist.
How to find the damage in WIMM
This is where the spending audit comes in.
Step 1. Look at the Groceries trend
Open the WIMM dashboard. The Income vs Expenses chart shows six months of activity. Switch the category filter to Groceries and you will see a clean line for your monthly grocery spend. If that line is climbing and you have not been eating more food, you are looking at tariff and general inflation pressure.
Step 2. Compare months side by side
The /budgets page shows your envelopes with monthly spend. Look at the Groceries envelope (or Food at Home, depending on how you have set it up) over the last six months. The trend often shows a stair step pattern: relatively flat, then a noticeable bump in the third or fourth quarter of 2025, then continued drift up.
Apply the same look to Dining Out, Coffee Shops, and Beverages as separate categories. The pattern often differs. Dining out is up partly because restaurants pass through their own tariff pressure on imported wine, seafood, and produce. Coffee at home is up because beans cost more. The mix is informative.
Step 3. Rerun Backtest with the higher numbers
If your Groceries envelope is now $200 below your real average, your budget is fiction. Take the new average and run Backtest against the last six months. The score will tell you, honestly, whether the plan you have today still fits the prices you actually pay. The free Backtest tool gives you that score in one click.
Step 4. Reassign categories where the AI has been overly generous
WIMM's AI categorization is good (we wrote a long piece about it), but tariff era spending is shifting which merchants get categorized where. Two things to check:
- Bulk imports at warehouse stores. A trip to Costco that used to be 60 percent groceries might now be 50 percent groceries and 50 percent household supplies after a tariff jump on imported paper products. Right-click the badge on the transaction and split or recategorize as needed.
- Wine and liquor. If you buy imported bottles via Total Wine or Specs, the price now includes a real tariff component. Some households want to track that separately. A custom Wine category under Groceries gives you visibility without cluttering the main view.
Three money moves that actually work

1. Switch a couple of imported staples to domestic substitutes
This sounds simple and it is. US-produced versions of frozen vegetables, frozen fish, butter, and cheese have moved less. Trying two or three swaps a week for a month is enough to find the ones that are actually acceptable to your household. Most people end up keeping about half.
2. Buy the categories that did not move on the tariff schedule
Dairy, eggs, frozen US grown chicken and pork, in-season produce. These have moved with general inflation but not with tariff impact. A meal plan that leans on those for two weeks a month tends to absorb the difference.
3. Cap the dining out envelope at last year's number, intentionally
Restaurants pass through more tariff cost than home cooking, because their supply chains are tilted toward imported ingredients (especially fish, wine, and produce). Holding dining out flat in dollar terms means doing it slightly less often, which is usually fine. Your dashboard will show whether the rest of the food spend balances.
The point of the exercise
Tariff inflation is not a story for op-eds. It is a story for your dashboard. Look at the categories that moved, see which ones can take a substitute, and reset the budget to a number you can actually hit. If the budget is still fiction, the next month plays out exactly like this one.
The live demo opens to the transactions list with sample data already categorized, so you can try recategorizing, splitting, and watching the dashboard update in real time: app.wimm.money/demo?mode=transactions.
References
- Brown, N. (2026, May 15). U.S. grocery coffee prices hit all-time average high in April. Daily Coffee News by Roast Magazine. https://dailycoffeenews.com/2026/05/15/u-s-grocery-coffee-prices-hit-all-time-average-high-in-april/
- Concord Monitor. (2026, April 25). Tariffs have increased prices in the last year, but the factors driving your grocery bill are layered. https://www.concordmonitor.com/2026/04/25/tariffs-impact-grocery-prices/
- Federal Reserve Bank of Dallas. (2026, May 5). Effects of realized tariff changes on PCE prices peaked in first quarter 2026. https://www.dallasfed.org/research/economics/2026/0505-mau
- U.S. Bureau of Labor Statistics. (2026). Consumer Price Index -- Food at home. U.S. Department of Labor. https://www.bls.gov/cpi/
- U.S. Department of Agriculture, Economic Research Service. (2026, May 22). Food Price Outlook: Summary findings. https://www.ers.usda.gov/data-products/food-price-outlook/summary-findings
- U.S. Joint Economic Committee, Democrats. (2026, March). UPDATE: Families to pay $2,500+ in tariff costs this year. United States Senate. https://www.jec.senate.gov/public/index.cfm/democrats/2026/3/update-families-to-pay-2-500-in-tariff-costs-this-year
- Yale Budget Lab. (2026, April 8). State of U.S. tariffs: April 8, 2026. Yale University. https://budgetlab.yale.edu/research/state-us-tariffs-april-8-2026
Try WIMM today
The demo loads with realistic data and no signup. See what this article describes in action.